Lockdown has not stopped Sydney’s market with dwelling prices growing 1.8% in August, taking the total growth since the beginning of 2021 to 19.7%. Which suburbs are driving the strongest price growth? The middle ring, mostly covering suburbs in parts of the inner west, north shore and eastern suburbs, recorded the strongest price growth since the previous market peak of 2017, with the house median up 15.7% and the unit median up a more subdued 3.2% to $890,000 – still short of the $1.03 million inner-city unit median. By comparison, house prices in the inner-city market, covering homes within 5 kilometres of the CBD where properties are often smaller, were up 11.6% year-on-year.
Despite the growth, listing levels have fallen to their lowest level in a decade. SQM research shows the total number of homes listed for sale has dropped 9.6% to 215,911 across the country. Sydney, Melbourne and Canberra have posted the largest monthly declines in total listings of 11.9% in Sydney, 13.1% in Melbourne and 18.4% in Canberra, and nationally new listings have fallen 7.8%.
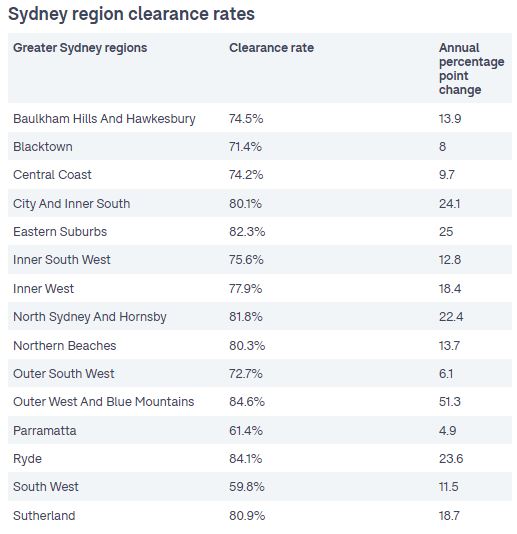
Upcoming auction listings in Sydney have fallen by 29% for September from a year ago, according to new data from SQM research. For the first four weeks of the spring selling season, a total of 2106 Sydney homes have been scheduled for auction, down from 2978 in the same period last year. Compared to the same period in 2019, before the pandemic, auction listings in Sydney were down 10.5%. Despite low auction listings, buyers continue to purchase property under the hammer at record rates. Sydney’s median auction house price has soared to a record $1.92 million, up an astounding 32.3% over the year and 11.8% in just one month. According to Domain, in the midst of lockdown — and winter — Sydney’s clearance rate of 77.3% was the highest for the month of August since their records began.